
In today's world, the impact of health disparities and social determinants of health on population well-being cannot be overlooked. To combat these challenges effectively, it is essential to utilize advanced technological tools. One such tool is ArcGIS, a powerful geographic information system (GIS) software that enables professionals in the health care field to better understand and address health disparities and social determinants of health. Dr. Kristy Bondurant, AFMC’s epidemiologist and director of data sciences and public health programs departments, and Sydney Lewis, supervisor of AFMC’s data sciences team, both know the impact ArcGIS can have on presenting near real-time data to the public in an impactful way.
IN THIS BLOG:
What is ArcGIS, and how does it help address health disparities?
ArcGIS is a geographic information system (GIS) software that enables health care professionals to collect, analyze, and visualize data related to health disparities and social determinants of health. By overlaying various data sets—such as demographic information, health care resources, environmental factors, and socioeconomic indicators—ArcGIS helps identify patterns and correlations that contribute to health disparities, allowing for evidence-based decision-making and targeted interventions.
How does ArcGIS enhance data visualization in public health?
ArcGIS adds a spatial component to data analysis, allowing health care professionals to see areas of need throughout the state and understand what intervention and prevention efforts would look like over time. This visual storytelling approach helps highlight needs and disparities, bringing further attention to important issues and gaps in health care access.
What role does near real-time data play in ArcGIS mapping?
ArcGIS supports the visualization of health disparities indices through mapping, enabling the presentation of near real-time data to the public in an impactful way. This timely data collection and sharing empower individuals and organizations to be part of the real-time data upload, enhancing the understanding of disparities in communities and allowing for quicker response and intervention.
How does ArcGIS mapping reveal health disparities?
An example includes tracking naloxone administration throughout the state. While it's known that naloxone administrations typically aggregate in more populous areas, ArcGIS mapping revealed that these points often follow interstate highways, providing new insights into patterns of opioid use and emergency responses.
How does ArcGIS accommodate users with disabilities?
ArcGIS offers accessibility features such as a color vision deficiency simulator, which can adjust map colors to accommodate individuals with colorblindness. Additionally, descriptions can be added to all images and maps, and an auto-translate feature is available to assist individuals who speak other languages, ensuring that data and maps are accessible to a broader audience.
What is the significance of data overlays in ArcGIS mapping?
Data overlays in ArcGIS allow researchers to compare and analyze multiple data sets simultaneously. For instance, mapping green spaces in urban areas alongside health disparity data can reveal correlations between the lack of green spaces and higher health disparities, insights that might not be apparent without such visual comparisons.
How does ArcGIS facilitate community involvement in data collection?
ArcGIS includes an interactive survey tool that allows individual community members and local organizations to upload their data to the platform. This feature empowers communities to participate actively in data collection, enhancing the understanding of local health disparities and contributing to more comprehensive and inclusive data sets.
Seeing the Whole Story
ArcGIS plays a crucial role in collecting and analyzing data related to health disparities and social determinants of health. By overlaying various data sets, such as demographic information, health care resources, environmental factors, and socioeconomic indicators, health care professionals and researchers can identify patterns and correlations that contribute to health disparities. This data-driven approach allows for evidence-based decision-making and targeted interventions to address the root causes of these disparities.
“ArcGIS has really changed the game in health care data collection through the ability to support the visualization of health disparities indices through mapping,” Dr. Bondurant says. Grouping data in a map allows health care professionals to see areas of need throughout the state and what intervention and prevention efforts would look like over time. ArcGIS changes the game in data analysis by adding visual elements that engage the audience and tell a story. “It’s revolutionized the way we look at patterns and trends in the data by adding a spatial component to that data we did not have before,” Lewis says.
Access to near real-time data with ArcGIS empowers individuals to be a part of the real-time data upload and enhance our understanding of the disparities that exist in our communities.
Mapping software adds substance to experiential and qualitative data from lived experience. “It helps us drive home what we already know to be true by using location-based data,” Lewis says. “It’s also a great way to visualize where things are happening. Often, we look at data conceptually, but ArcGIS mapping allows us to look between the lines and see the whole story.” Data presented in a visually compelling way helps to highlight needs and disparities, bringing further attention to important issues and gaps throughout the state. Analyzing data conceptually allows for understanding, but adding a visual component to the data insights change. ArcGIS provides scientists with layered mapping that allows them to directly address problems and focus their prevention efforts on specific needs. This empowers them to make a positive impact and work towards finding solutions.
One example of the value ArcGIS mapping has had on data analysis comes from tracking naloxone administration throughout the state. “We all know that Naloxone administrations typically aggregate in more populous areas of the state,” Lewis says, “but it is really telling to see those points and realize that they follow the interstates. You can literally map out where overdoses are happening based on where the interstates are.” Opioid prevention organizations used to identify hubs throughout the state, such as Little Rock, Northwest Arkansas, and even West Memphis, where overdoses frequently occurred, but ArcGIS provided a visual component that allowed scientists to see data at a more granular level. “The mapping provides a way to separate assumptions made from what people have thought or seen from what the data is actually telling us,” Dr. Bondurant says.
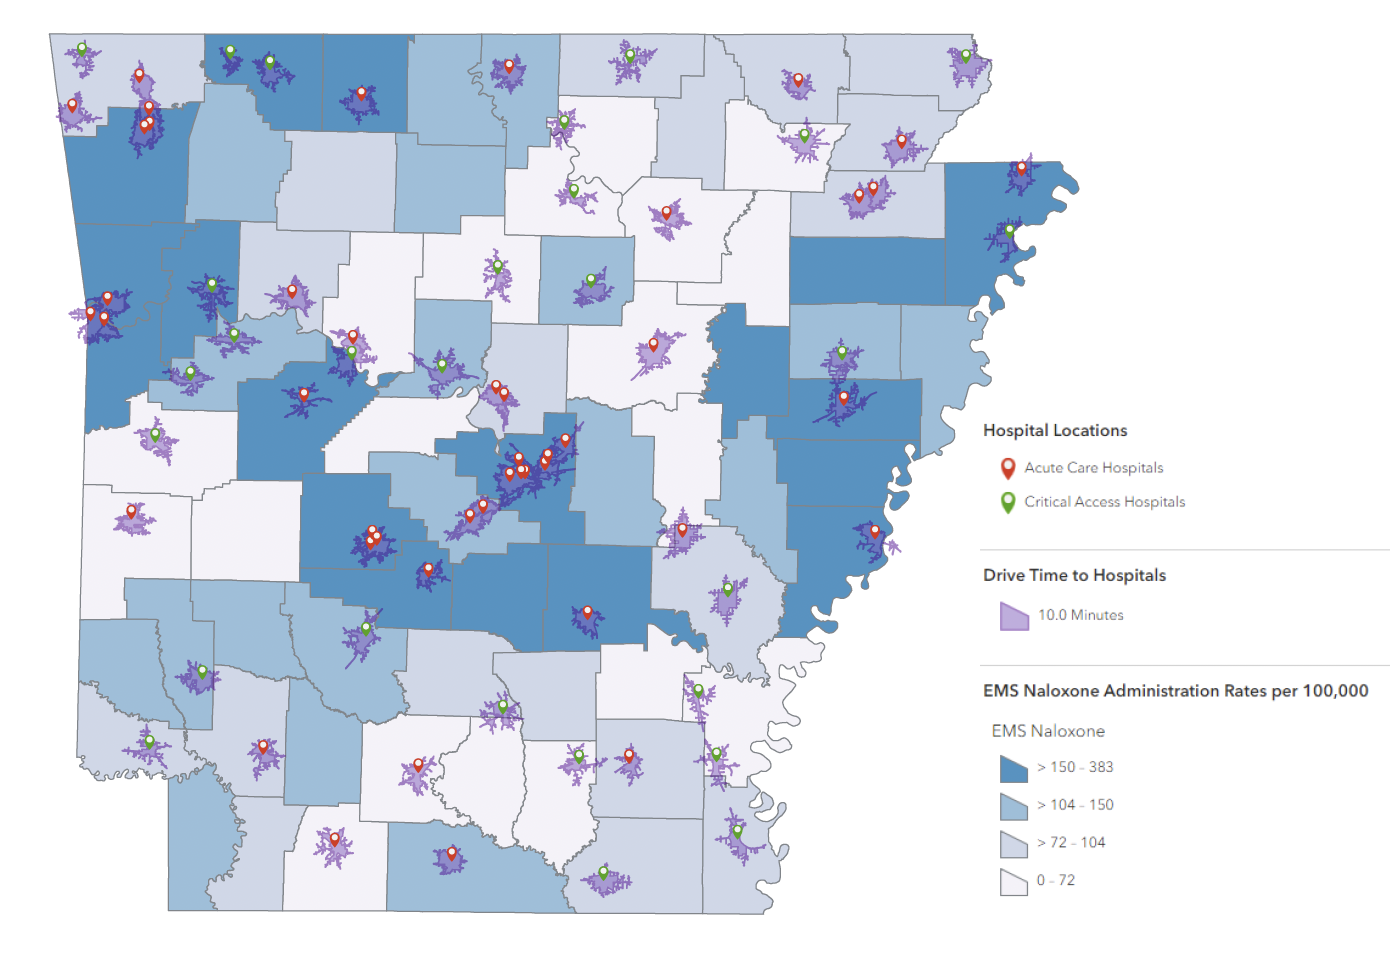
ArcGIS provides a visual component other programs cannot, allowing researchers to view critical data, such as Naloxone administrations in Arkansas.
“Now that we know the hot spots that are just off the interstate, we can reshape our resource allocation for harm reduction items like Naloxone to cover those areas as well,” Lewis adds.
Overlays Paint a Clearer Picture
ArcGIS mapping uses overlays to compare data easier than before. “Through mapping, you can see something as simple as green spaces in an urban area,” Dr. Bondurant says. “Some studies show that where green spaces are missing is where you have higher health disparities. We wouldn’t have been able to notice that without mapping overlays.” Some of the data may not seem to be connected until they are overlayed on a map. Then, additional information becomes visible. “Now, we’re not just looking at and talking about data on a map. We’re actually building a story around the data,” she adds. The general public may get overwhelmed by all of the numbers and statistics, which can be overwhelming. “Presenting the data with ArcGIS is usable for the public and allows you to disseminate your findings in a simpler way,” Lewis says.
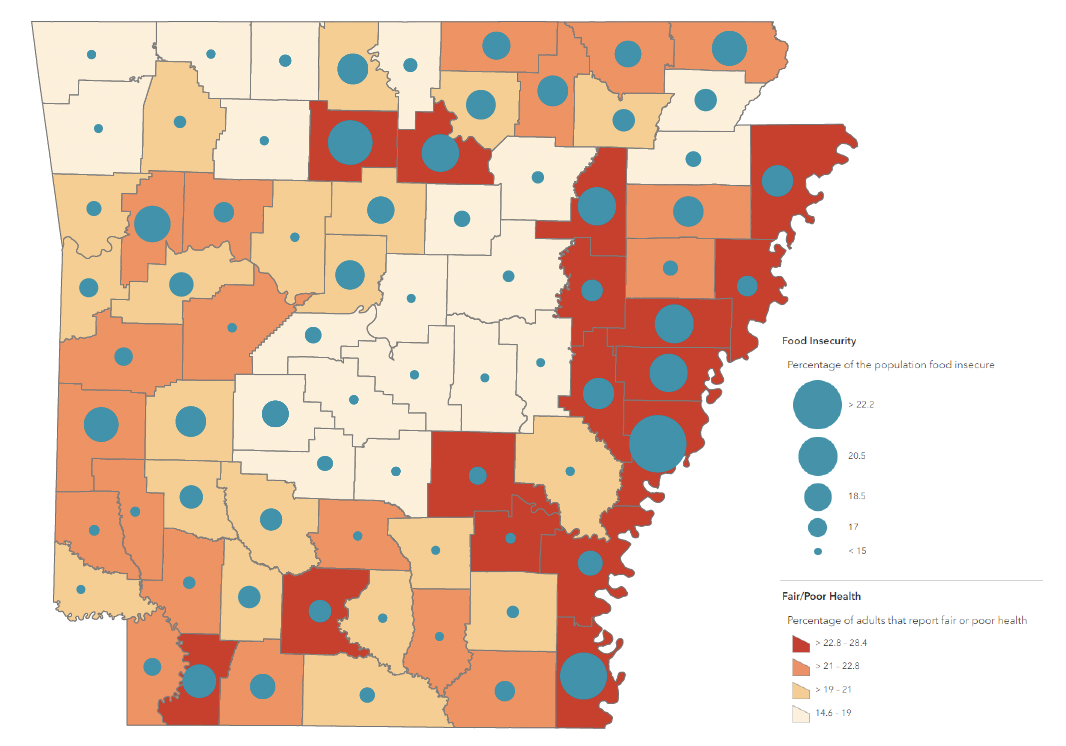
Data overlays allow researchers to make informed decisions about two seemingly unrelated data elements, such as food insecurity and population health.
That is where the true value of ArcGIS mapping lies: in the story. Accompanying near real-time data with a story allows researchers and scientists to explain what’s going on in the community and show an accompanying map while also crafting a compelling story that community leaders can use to plan out their actions.
ArcGIS has revolutionized the way we look at patterns and trends in the data by adding a spatial component to that data we did not have before.
Once the data is collected and analyzed, ArcGIS allows for the development and implementation of effective prevention strategies. With its spatial analysis capabilities, professionals can identify areas with high health disparities and social determinants of health and allocate resources accordingly. For example, by mapping healthcare facilities, transportation routes, and socioeconomic data, healthcare organizations can identify underserved areas and create targeted programs to improve access to care, education, and other essential services.
Near Real-Time Data and Data Sharing
Along with the visual capabilities that ArcGIS provides, the COVID-19 pandemic also started a push for faster data collection. “People used to think that, even for data updates, you were going to be one to two years behind. COVID showed that you can get data much quicker. As a result, there’s been a big push for real-time data,” Lewis says. Now that data is coming out much quicker, and the data is changing just as quickly as the landscape is changing, having real-time data makes mapping software like ArcGIS that much more valuable. Prevention efforts can begin much sooner. “We can anticipate changes much quicker with real-time data, which also allows us to act much quicker, too,” Lewis adds.
Another invaluable piece of ArcGIS, aside from collecting near real-time data, is that individual members of the community and local organizations can upload their data to the ArcGIS platform via an interactive survey tool. “This empowers individuals to be a part of the real-time data upload and enhance our understanding of the disparities that exist in our communities,” Dr. Bondurant says.
Accessibility
ArcGIS also offers a variety of accessibility features that make the data and maps accessible to people with disabilities or other impairments. “For individuals with visual impairments, including colorblindness, ArcGIS offers a color vision deficiency simulator, which can change the color of the maps to accommodate individuals with colorblindness to red, green, and blue,” Dr. Bondurant says. “You can also add descriptions to all images and maps so that an individual with visual impairment would still be able to read them,” Lewis adds. ArcGIS also offers an auto-translate feature so that individuals who speak other languages can also get the most out of the StoryMaps and data.
ArcGIS mapping is a powerful tool that aids in addressing health disparities and social determinants of health. By overlaying various data sets and using spatial analysis, health care professionals and researchers can identify patterns and correlations that contribute to disparities and address them at a granular level. ArcGIS allows for evidence-based decision-making, targeted interventions, and the development of effective prevention strategies. The visual capabilities of ArcGIS help to present data in a compelling way, highlighting needs and disparities in a way that the public can understand. With near real-time data and data sharing capabilities, ArcGIS enables faster response and community involvement. Additionally, ArcGIS offers accessibility features to ensure that the data and maps are accessible to all individuals. Overall, ArcGIS plays a crucial role in understanding and addressing health disparities, making it an invaluable tool in the health care field.
For more information on important health care topics, follow AFMC on Facebook, Instagram, LinkedIn, Twitter, and YouTube.
Subscribe to our newsletter for the latest news and updates, including the most recent episode of AFMC TV.
Meet Dr. Kristy Bondurant
 Dr. Kristina Bondurant is an immunologist, microbiologist, and epidemiologist. She graduated from Hendrix College in 1997 with a BA in Biology. Dr. Bondurant received her PhD in immunology and microbiology in 2004 and her Master of Public Health with an emphasis on epidemiology in 2011, both from the University of Arkansas for Medical Sciences (UAMS). Throughout her career, she has developed a diverse set of skills. Her current work includes Director for Public Programs at the Arkansas Foundation for Medical Care (AFMC), leading COVID response efforts including case investigation, contact tracing, vaccination clinics, vaccine inspections, and COVID testing under contract with the Arkansas Department of Health. She also consults as a microbiologist at a local food safety testing laboratory. Dr. Bondurant serves on the board of directors for Home for Healing, a central Arkansas non-profit providing no cost housing option and support services for cancer and NICU patients and families during treatments. Dr. Bondurant enjoys sharing her love of science with children through hands on science education in local elementary schools. She also published a children's book with award-winning author Jen Holman and award-winning artist Cary Smith. Mira Does Her Part is a beautifully illustrated story of one child’s quest to vanquish a virus through healthy habits. Dr. Bondurant is a native Arkansan raising two children with her husband and her grumpy chihuahua mix.
Meet Sydney Lewis
 Sydney Lewis graduated with a bachelor’s degree in psychology from Lyon College in 2016 and a Master of Public Health with a concentration in biostatistics in 2019. She is the supervisor of Data Sciences at AFMC, where she works on program evaluations for various grants, both in an out of state, including the State Opioid Response (SOR), First Responders-Comprehensive Addiction & Recovery Act (FR-CARA), and New Hampshire Department of Health and Human Services Program Evaluation and Data Services for the Alcohol and Other Drug Services System grants. She has advanced competencies in various software programs, including SAS, REDCap, and ArcGIS.